Browsing and viewing events
Table of contents
- Starting the browser
- Browser layout
- Selecting event types
- Plot options
- Terminal output
- Viewer processes
REST files can be inspected interactively with TRestBrowser. The browser opens a graphical window with an event display and controls for moving through the entries stored in a REST file.
For quick one-event drawing examples, see Drawing event data. This page focuses on the interactive browser.
Starting the browser
From a shell, use:
restViewEvents myFile.root
The same browser can be started from a restRoot session:
REST_ViewEvents("myFile.root");
Both commands use the REST macro REST_ViewEvents.C, which creates a TRestBrowser and opens the file.
Browser layout
The browser shows the current event on the right and the navigation controls on the left.
The screenshot above shows a TRestTrackEvent. The same browser can display other event types when they are available in the file.
The left panel contains:
- Entry: load an event by entry number in the tree.
- Event ID and Sub ID: load an event by REST event identifier.
- Event Type: select one of the event representations available in the file.
- Plot Options: pass drawing options to the event viewer.
- Previous/next controls: move through events or plot options.
The event display uses the event class drawing implementation, usually DrawEvent(). For example, a TRestRawSignalEvent is drawn as waveforms, a TRestDetectorSignalEvent as detector-channel signals, and a TRestTrackEvent as track projections.
Selecting event types
Some REST files store more than one event representation. For example, a file may contain raw signals, detector signals, detector hits, and tracks produced by the same processing chain.
Use the Event Type selector to choose which representation to inspect. This is useful when checking how one event changes through the processing chain:
  -> TRestRawSignalEvent
  -> TRestDetectorSignalEvent
  -> TRestDetectorHitsEvent
  -> TRestTrackEvent
If you already know which event type you want to view, it can also be passed to the macro:
REST_ViewEvents("myFile.root", "TRestDetectorSignalEvent");
For detector signal events, there is a convenience wrapper:
REST_ViewSignalEvent("myFile.root");
Plot options
The plot options box forwards text options to the event drawing method. Available options depend on the event class.
For example, raw signal events support options such as:
ids[800,900]:printIDs
or:
signalRangeID[800,900]:onlyGoodSignals[3.5,1.5,7]:baseLineRange[20,150]
These are interpreted by TRestRawSignalEvent::DrawEvent. Other event classes have their own drawing behavior and may accept different options.
Terminal output
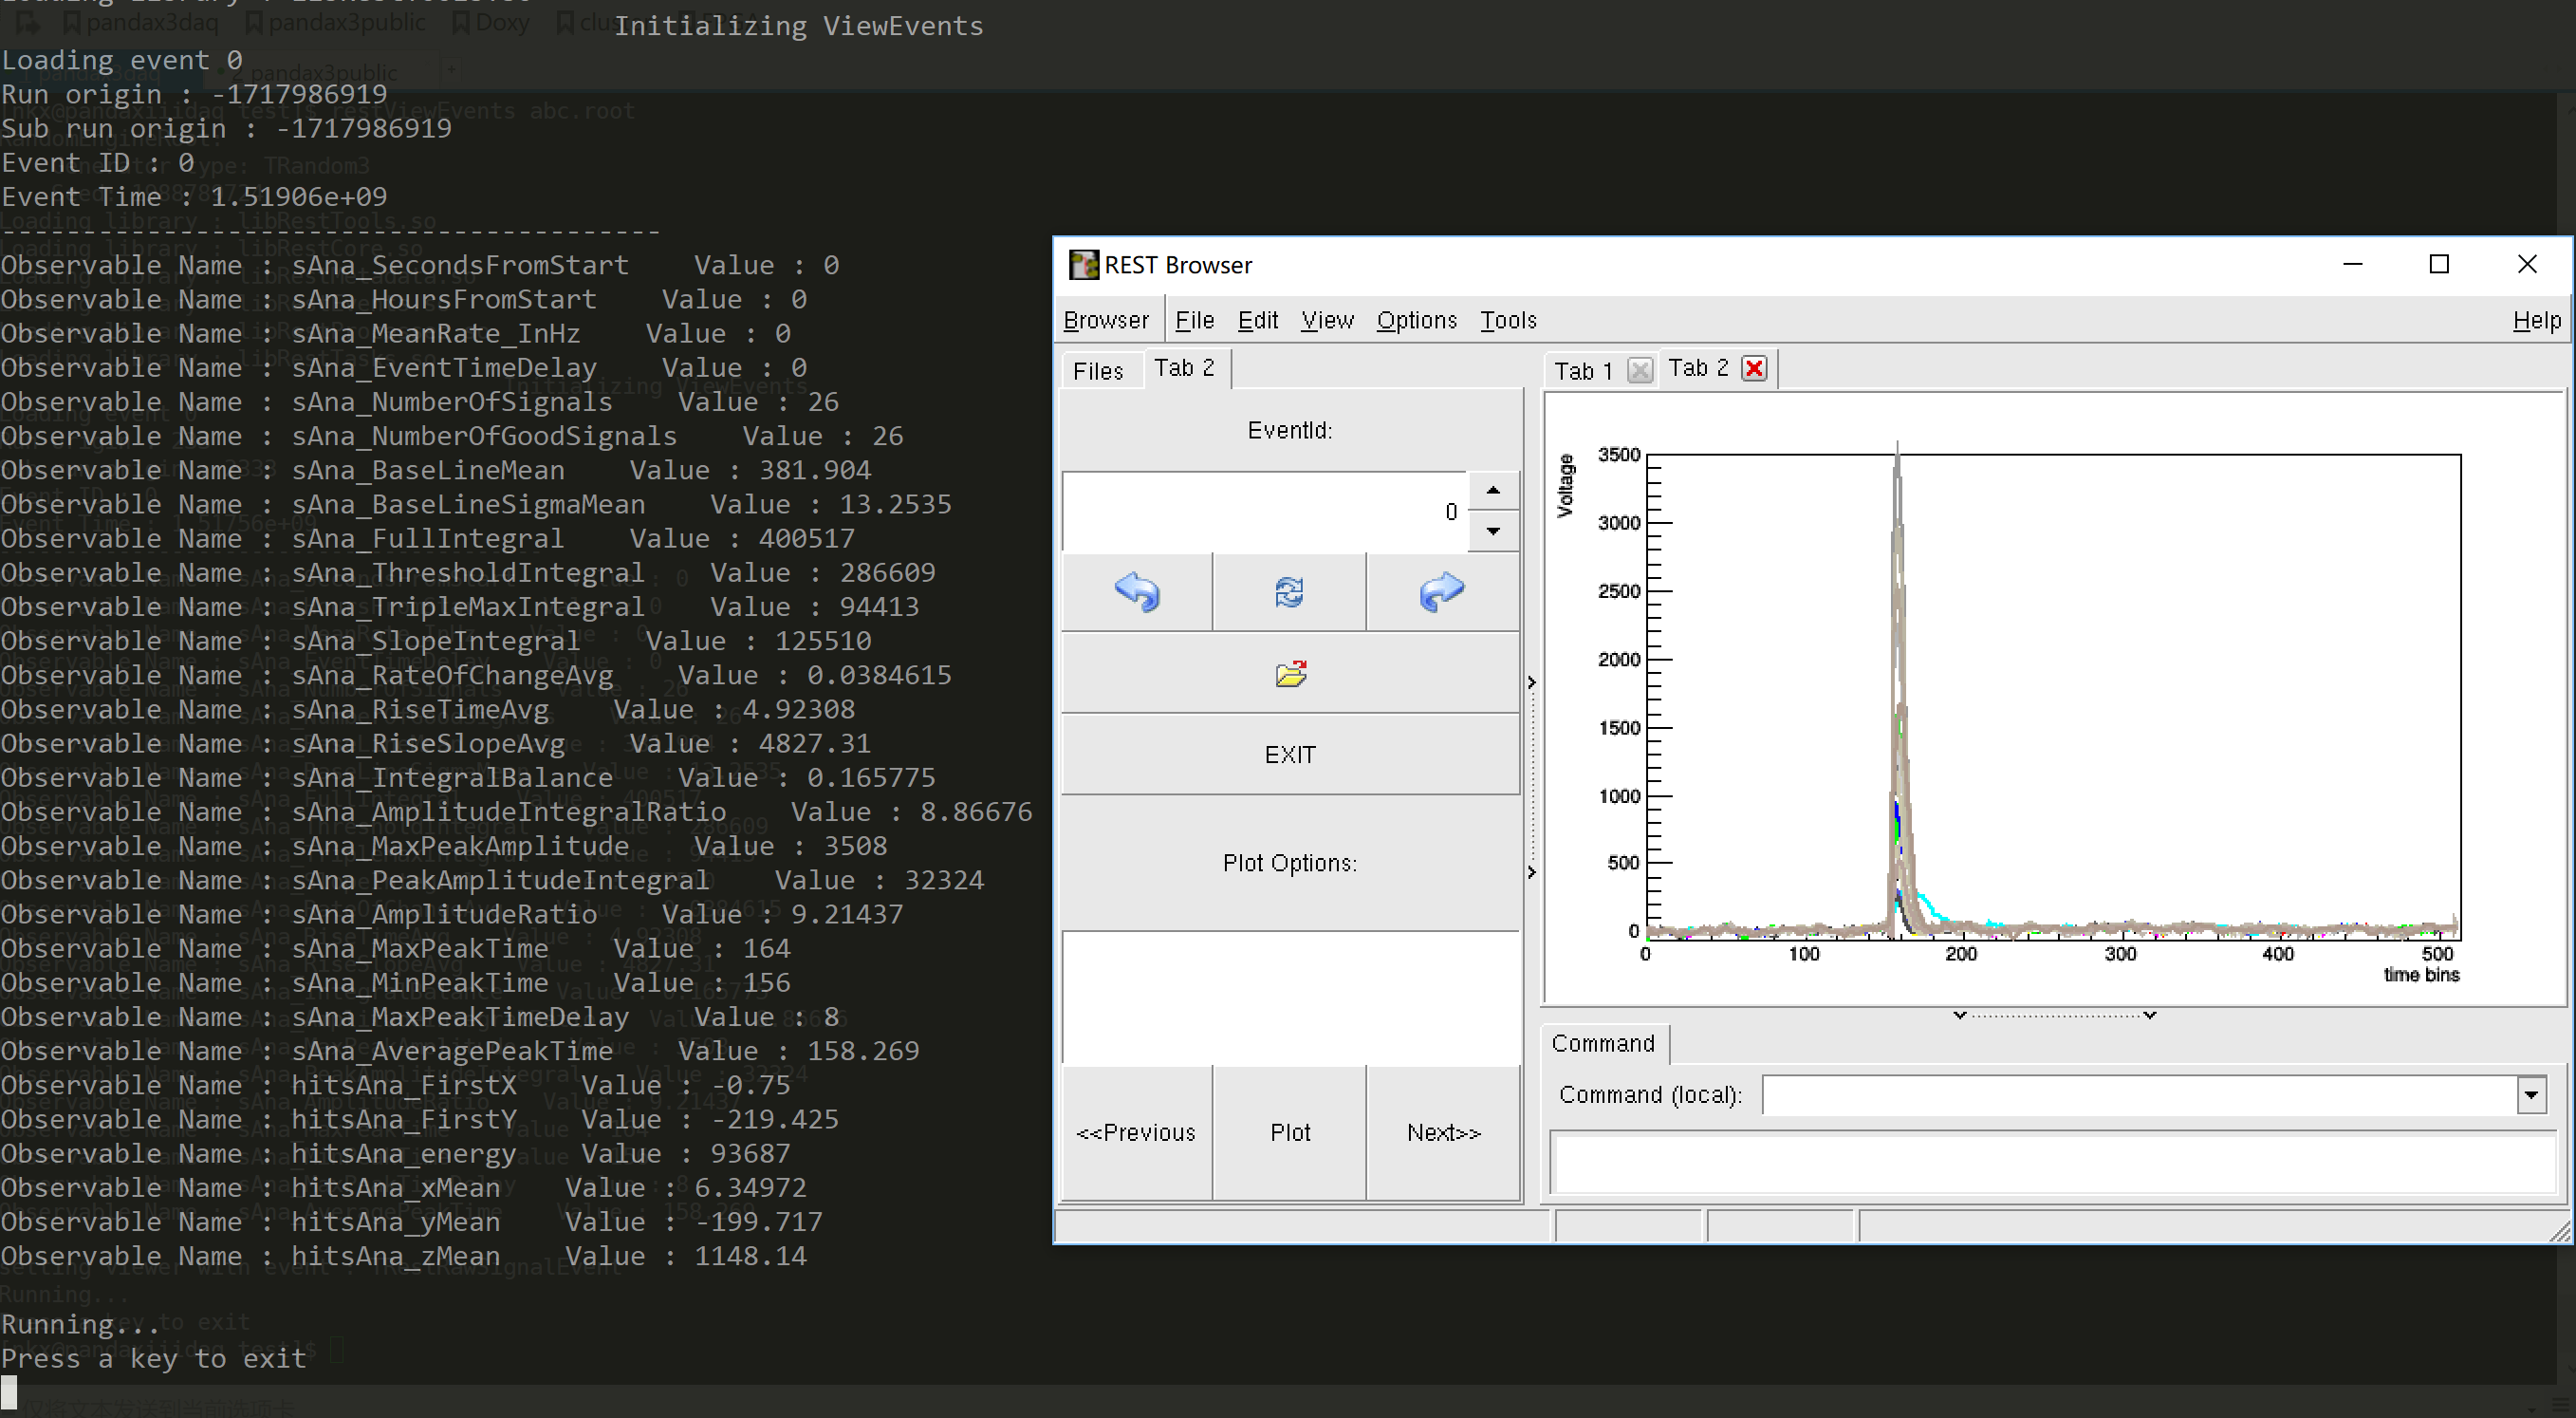
When the browser loads an event, REST also prints information in the terminal. This usually includes the event ID, timestamp, event content summary, and the analysis observables stored for that entry.
This terminal output is useful because it connects the visual event display with the observables in the analysis tree. For example, while the browser shows a track event, the terminal can show the corresponding track, hit, signal, and rate observables for the same entry.
Viewer processes
REST also provides viewer processes that can be inserted in a processing chain to display events while the chain is running. These are useful for debugging a configuration or checking intermediate event representations.
Viewer processes require a graphical session and normally force the processing chain to run in single-thread mode.
Examples include:
TRestDetectorSignalViewerProcessTRestTrackViewerProcess
Use these when the goal is to inspect events during processing. Use TRestBrowser when the goal is to inspect events already stored in a REST file.