Using TRestAnalysisPlot for systematic plot generation
Table of contents
- Adding multiple input files
- Systematic plot generation after data processing
- Plot and histo definitions
- cuts and file selection
It is possible to produce, visualize and store histograms using the observables defined inside the TRestAnalysisTree in a systematic way. The metadata class TRestAnalysisPlot allows us to define few plots, containning different histograms inside a RML definition. The advantage is that this RML definition can be reused on the generation of systematic plots with different datasets. The plots generated by TRestAnalysisPlot will be saved to disk in different formats suported by ROOT, as PDF, ROOT or C.
In order to use it we need to define a TRestAnalysisPlot section inside the TRestManager section. A template of a RML configuration file example can be found at the examples directory inside the main REST framework repository.
That example can be executed as follows:
restManager --c plotAnaSpectrum.rml --i abc.root --p ouput.pdf
where abc.root is a file containning the observable names used in the example, sAna_ThresholdIntegral, sAna_BaseLineSigmaMean, etc.
Adding multiple input files
An interesting advantage of using TRestAnalysisPlot is to combine the results of different files corresponding to a common dataset, i.e. experimental data split into different files with a common run number, or a Montecarlo simulation parallelized at a batch job system, and split it into different files with a common run tag.
There different options to define the input files:
- Specifying several
--for--iarguments. - Providing a glob pattern between quotes, just as
--f "Run01234*Calibratio*Hits*.root". - Providing it at the
inputFileNameparameter inside TRestRun. Multiple input files are supported also with this method.
Systematic plot generation after data processing
It is also possible to run an event processing chain and see the result on analysis plot at once. TO achieve that we just need to add the <TRestAnalysisPlot section after <TRestProcessRunner section. REST will automatically use the output file resulting from the data processing as the input file for the analysis plot generation.
Plot and histo definitions
The definition of plot objects inside the rml file follows the section hierarchy:
- TRestAnalysisPlot
- plot
- histo

At each level we have different parameters to set. Under the main TRestAnalysisPlot section, we first add a section like:
<canvas size="(1000,800)" divide="(2,2)" save="plot.pdf" />
This defines the canvas and divide it into several pads. Each pads is configured by the following <plot section:
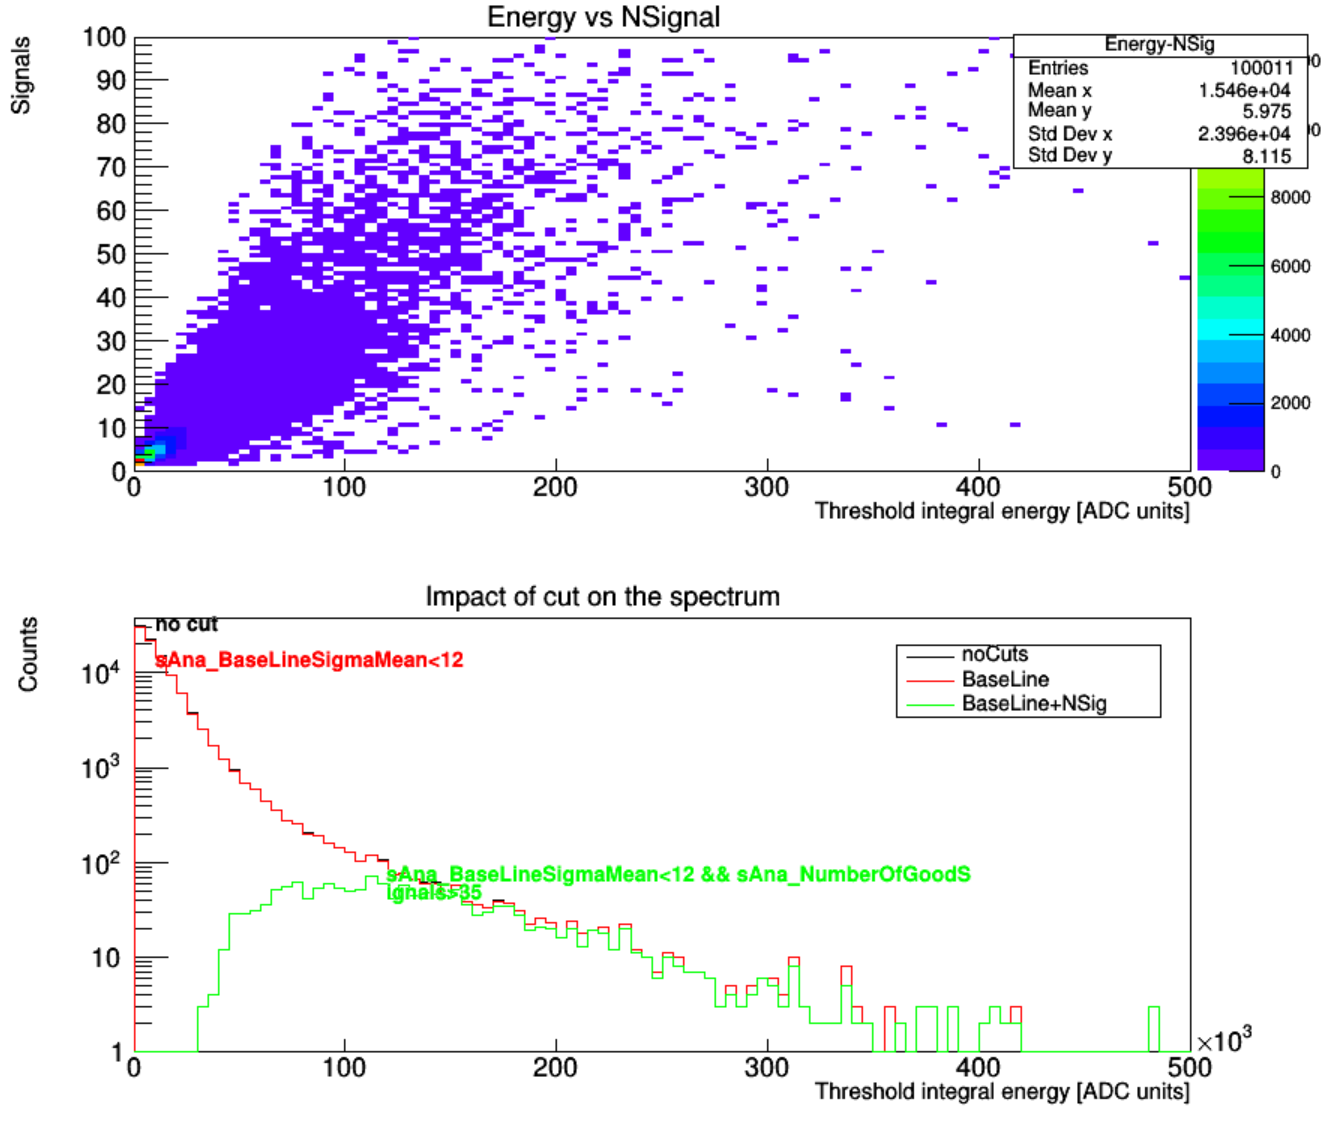
<plot name="Spectrum_CutImpact" title="Impact of cut on the spectrum" xlabel="Threshold integral energy [ADC units]" ylabel="Counts" logscale="true" legend="on" annotation="on">
…
</plot> This sets the axis title and switch the log scale. We can also call to add additional objects on the plot, i.e., legend and annotation.
Under the plot we need to add histo. It is possible to add multiple histograms on a same plot for convenience of comparing. The histo section is like:
<histo name="noCuts">
<variable name="sAna_ThresholdIntegral" nbins="100" />
<parameter name="lineColor" value="1"/>
</histo>
, where we define the used variables and the drawing style. The variable is same as “observable” in AnalysisTree in input file. If we add one variable, then it draws a TH1. If we add two variables, it draws a TH2, whose X axis is the first added variable. Number of bins and range of variable can both be set.
Note that if there is only one histogram, the content inside <histo section can also be put inside <plot section, in order to reduce the code.
cuts and file selection
Now we define another histogram with some cuts:
<histo name="BaseLine">`
<variable name="sAna_ThresholdIntegral" nbins="100" />
<cut variable="sAna_BaseLineSigmaMean" condition="<12" value="ON" />
<parameter name="lineColor" value="2"/>
</histo>
In this example we add a cut that the observable “sAna_NumberOfGoodSignals” should be greater than 1. Note that standard xml needs escape string to express the symbol >. Though this symbol still works out of some reason, we suggest using > instead of > for a good habit.
REST supports multiple input files for analysis plot, also by inputing quoted file name pattern in the --i argument. All the files will contribute to the plotted histogram. Sometimes we want to draw two histograms from two different files to compare, then a filter for the files is needed. We can add a <classify section under this <histo section. For example, <classify runTag="NLDBD"/> selects only the files with run tag equals to “NLDBD”. The run tag is a TRestRun data member saved in file. Despite TRestRun information, other supported fields of classification include FileName, Date, Size, etc.